Unity Store Asset
Azkar Screen Stats
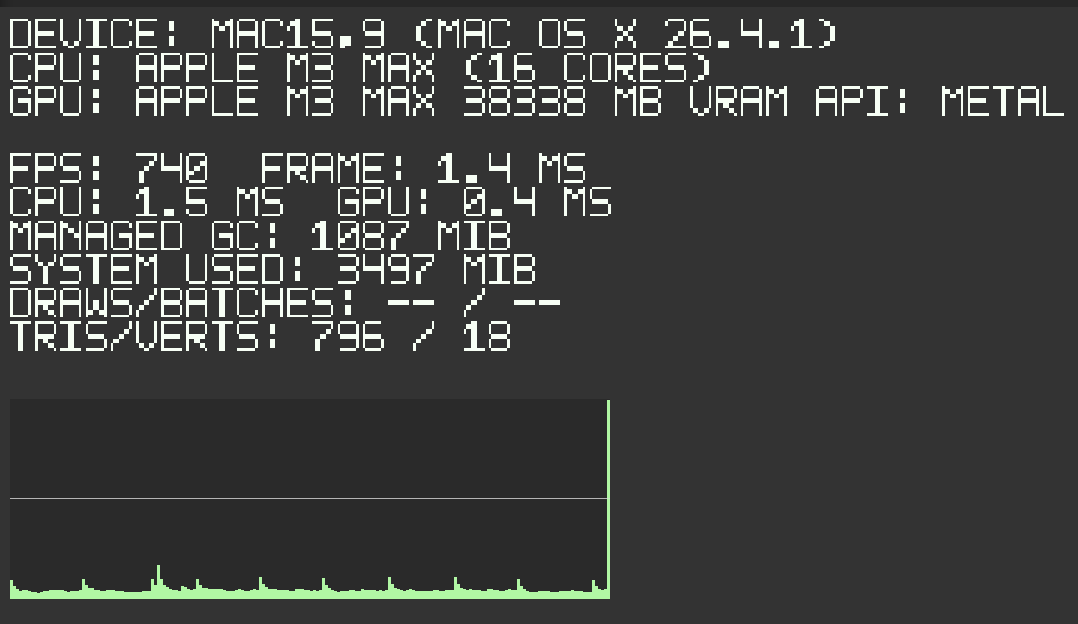
Unity diagnostics
Azkar Screen Stats is a free, lightweight Unity runtime performance overlay for FPS, frame timing, memory, render counters, device info, and frame-time graphing.
Store channelUnity Asset Store
Core coverageFPS, memory, frame graph
Store statusComing soon
Purpose
Performance data without building a diagnostics UI.
Azkar Screen Stats shows runtime performance state during play: add it to a scene, press Play, and review current performance without opening the full Unity Profiler or wiring a custom debug panel.
Runtime shape
A compact overlay designed for active testing.
The overlay renders through a camera-attached mesh and generated bitmap font atlas, with fixed buffers and configurable update rates for text and graph geometry.